Automated Financial Data Analysis Pipeline
Design and implementation of a zero-touch ingestion-to-dashboard system for daily financial survey data, reducing manual overhead and errors
Project Overview
This project automates the entire process of receiving, processing, and visualizing daily financial survey data from emails. Using Microsoft Power Automate, Python scripts, cloud storage APIs, Power Query, and Power BI, I built a zero-touch pipeline that retrieves email attachments, cleans and merges the data, and generates an interactive dashboard updated daily—eliminating the need for manual intervention and minimizing errors.
Client Requirements
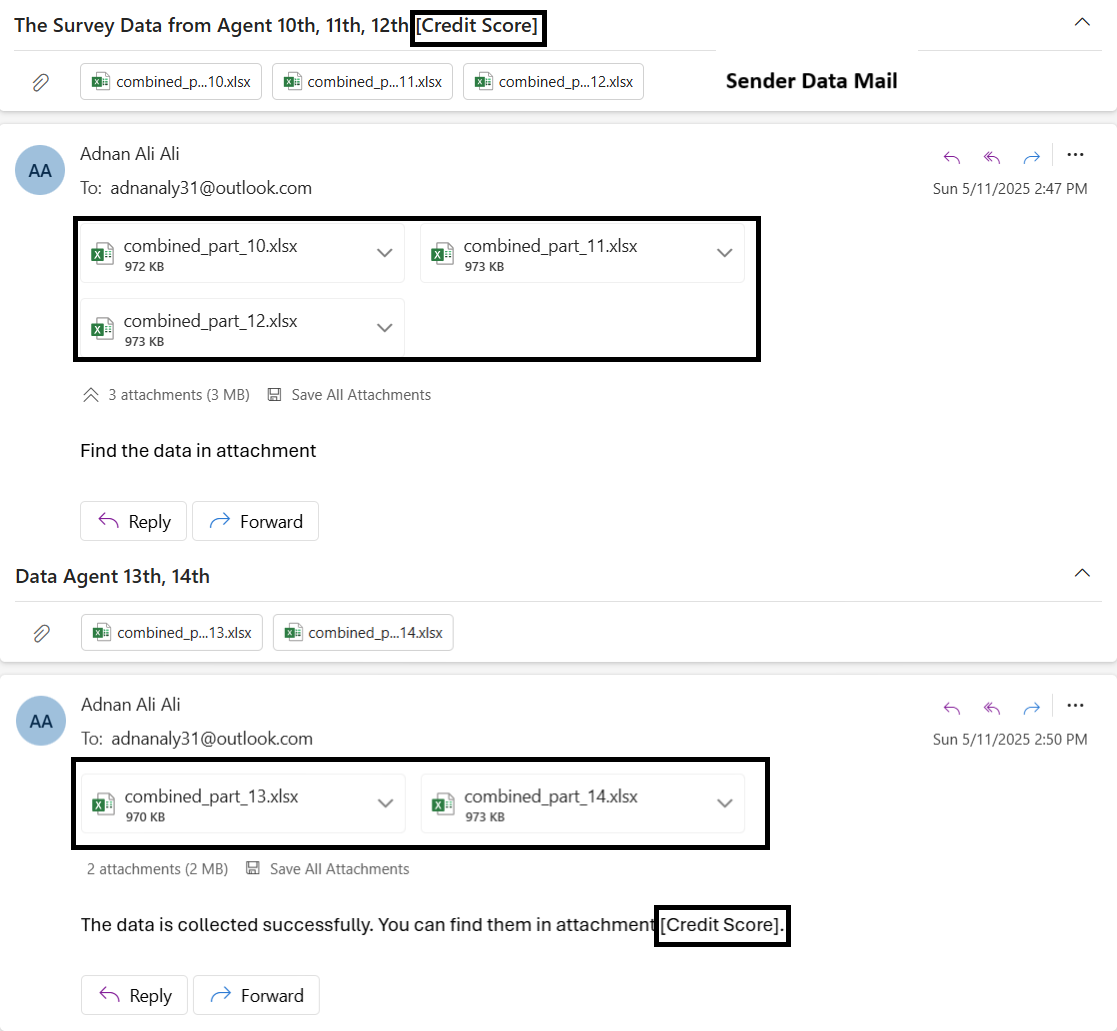
Every day by 3 pm, they receives ~25 Excel/CSV files via email from a distributed US government survey team. These needed data file to be consolidated, cleaned, and visualized in a dashboard by 8 pm. They want automate the entire pipeline—from email retrieval and file extraction to data processing and dashboard updates—ensuring daily delivery with zero manual effort, improved accuracy, and scalability.
- Timely Delivery: Consolidated dashboard by 8 pm without manual bottlenecks.
- Accuracy: Eliminate data-entry errors and inconsistent formats.
- Cost Efficiency: Replace $12K/month in manual labor with automation.
- Scalability: Handle growing file volumes and evolving analysis tasks.
View Original Task Email
Pipeline Steps
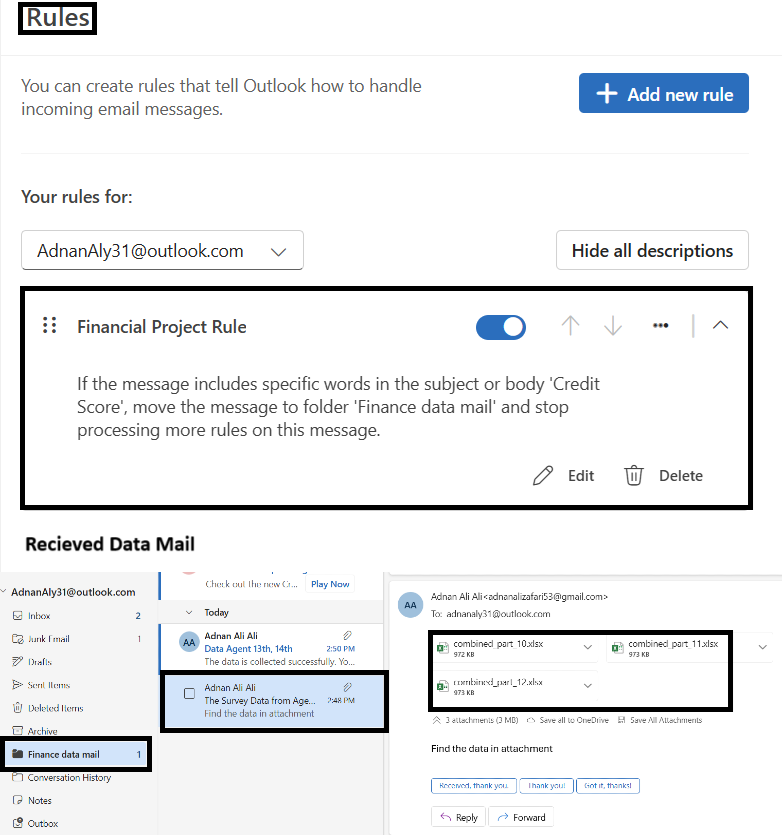
1. Email Collection (Outlook Rule)
Created a rule to filter survey-related emails with keyword "credit score" into a dedicated folder.
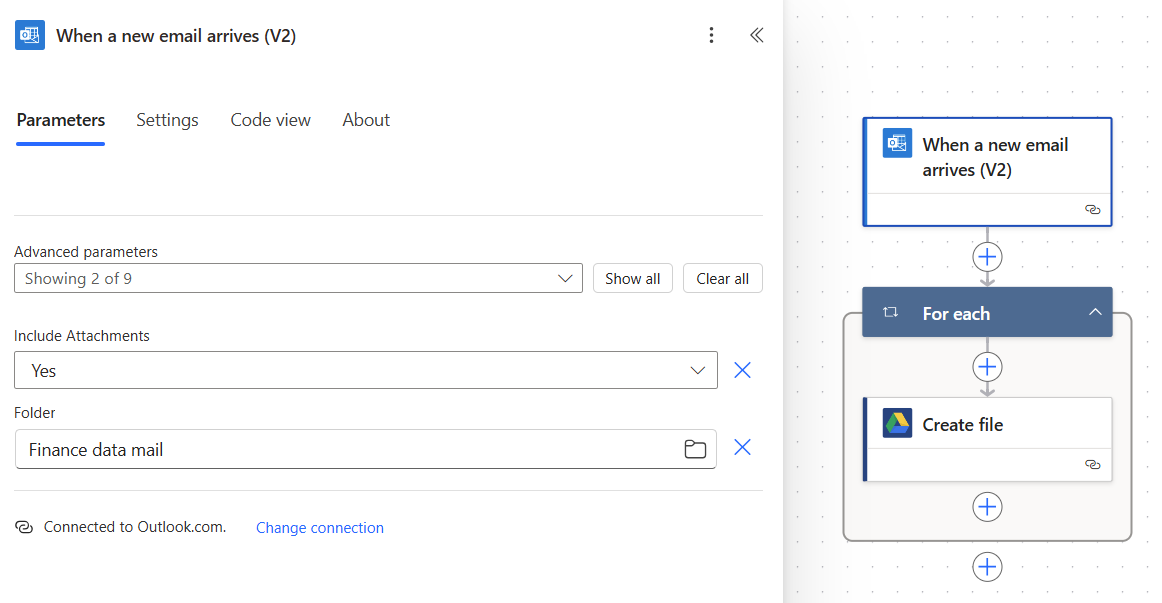
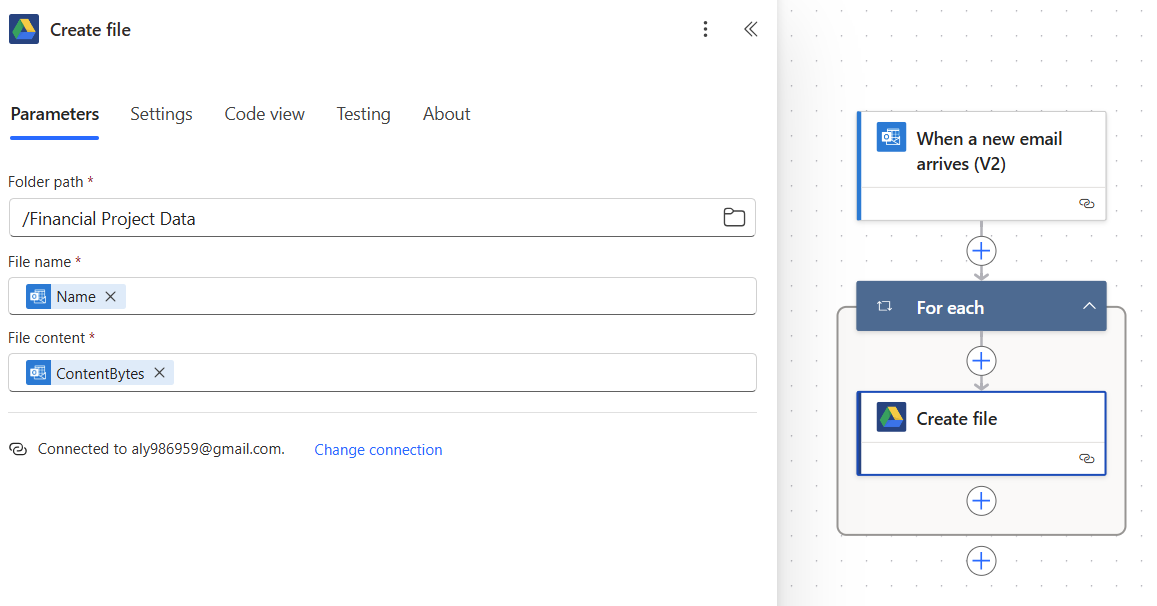
2. Attachment Extraction (Power Automate)
Used Microsoft Power Automate Cloud Flow to detect new emails in the Finance Data mail and download attachments to Google Drive.
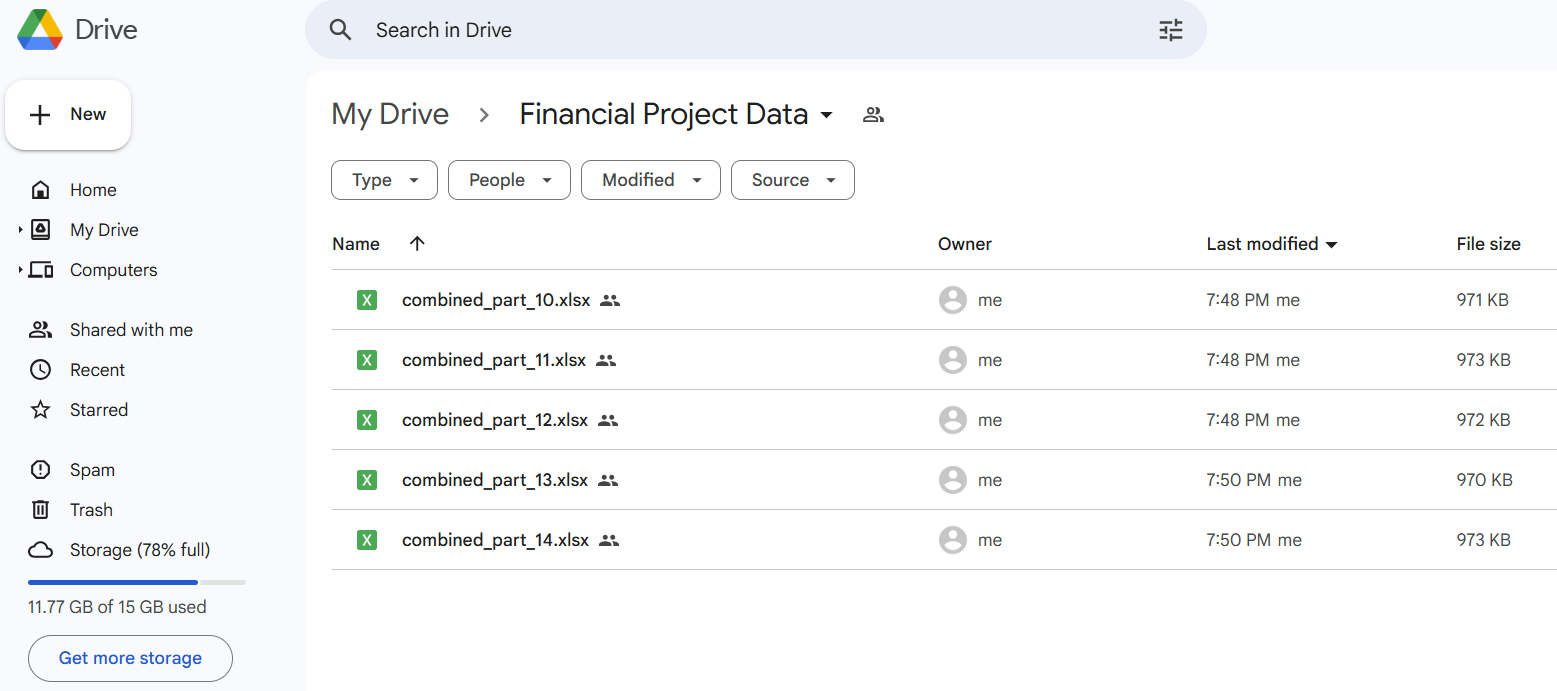
3. File Consolidation (Python + Google Drive API in Power BI)
A Python script is directly used as a data source in Power BI to automate the consolidation of survey files from a shared Google Drive folder.
- Authenticated using a Google Service Account (with Viewer access) via the Google Drive API.
- The script lists and fetches CSV, Excel, and Google Sheets files from the specified folder.
- Files are read and processed with
pandas, then merged into a single DataFrame. - Power BI consumes this live output, ensuring fresh, up-to-date data without manual uploads.
This method ensures seamless and automated integration of cloud-hosted survey data into Power BI dashboards.
Python script code
from google.oauth2 import service_account
from googleapiclient.discovery import build
import pandas as pd
import requests
from io import StringIO
from io import BytesIO  # For handling Excel files

# Replace with the path to your service account credentials
SERVICE_ACCOUNT_FILE = "C:\\Users\\aly98\\Downloads\\myfirstproject-397107-12e2d187a167.json"
SCOPES = ['https://www.googleapis.com/auth/drive.readonly']

# Authenticate and create the service
credentials = service_account.Credentials.from_service_account_file(
    SERVICE_ACCOUNT_FILE, scopes=SCOPES)
service = build('drive', 'v3', credentials=credentials)

# Replace with your Google Drive folder ID
FOLDER_ID = 'put your folder id'

def list_files(service, folder_id):
    results = service.files().list(
        q=f"'{folder_id}' in parents",
        fields="files(id, name, mimeType)"
    ).execute()
    return results.get('files', [])

# Fetch the files
files = list_files(service, FOLDER_ID)

# List to store dataframes for file content
file_dataframes = []

for file in files:
    file_id = file['id']
    file_name = file['name']
    mime_type = file['mimeType']

    # Check if the file is Google Sheets, CSV, or Excel
    if mime_type == 'application/vnd.google-apps.spreadsheet':
        download_url = f"https://docs.google.com/spreadsheets/d/{file_id}/export?format=csv"
    elif mime_type == 'text/csv' or mime_type == 'application/vnd.openxmlformats-officedocument.spreadsheetml.sheet':
        download_url = f"https://drive.google.com/uc?export=download&id={file_id}"
    else:
        continue

    response = requests.get(download_url)
    if response.status_code == 200:
        if mime_type == 'application/vnd.openxmlformats-officedocument.spreadsheetml.sheet':
            df = pd.read_excel(BytesIO(response.content))
        else:
            df = pd.read_csv(StringIO(response.content.decode('utf-8')))
        file_dataframes.append(df)
    else:
        print(f"Error downloading file: {file_name}")

if file_dataframes:
    combined_df = pd.concat(file_dataframes, ignore_index=True)
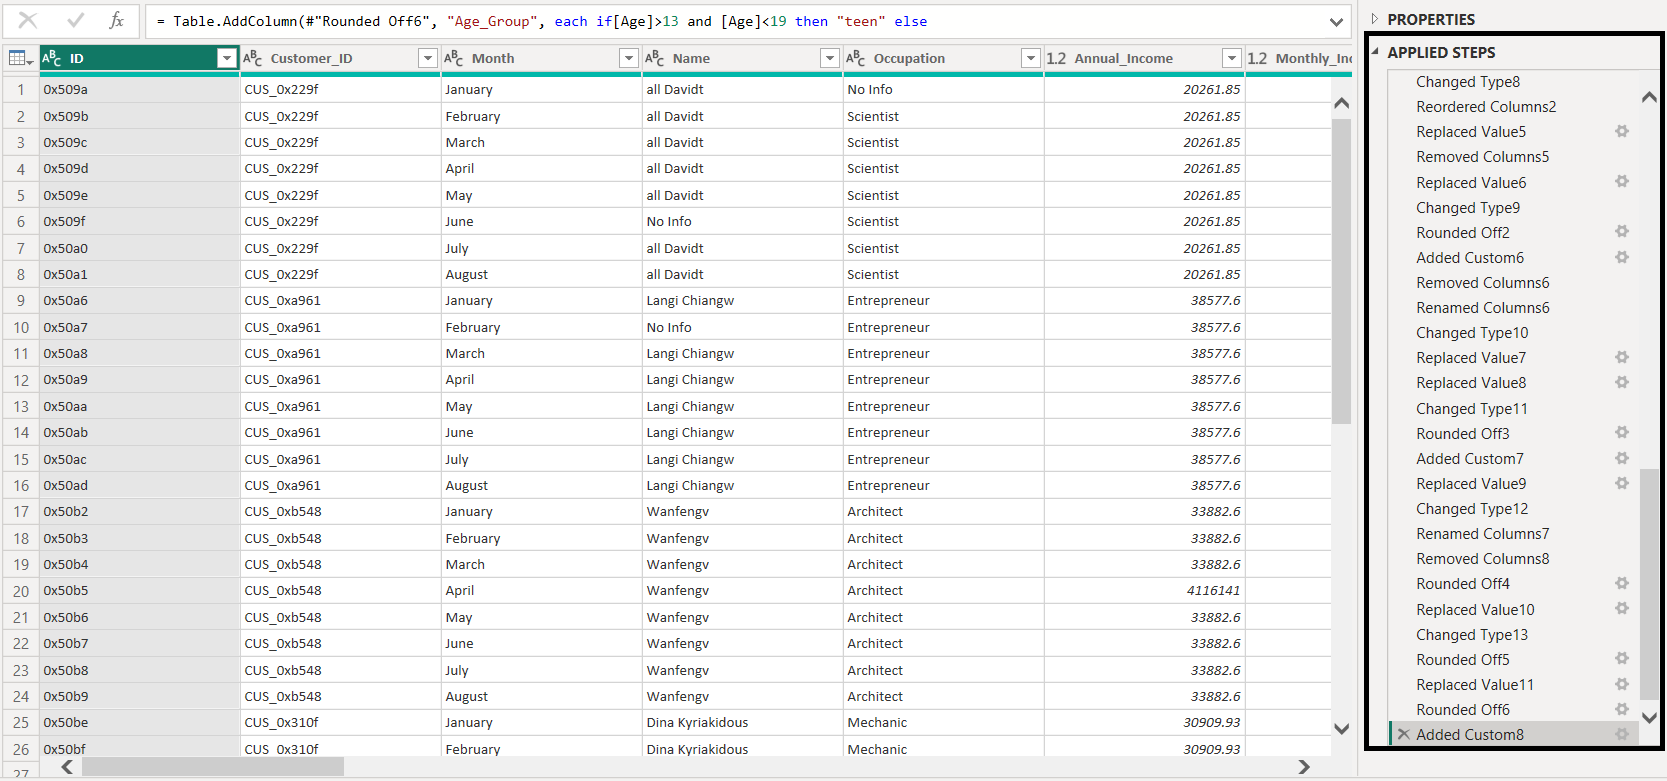
4. Transformation (Power Query in Power BI)
Used Power Query's M code to shape the data: type conversions, deduplication, null filtering, and calculation of new columns such as AgeGroup, num_of_credit_card, and data folding optimization for performance.
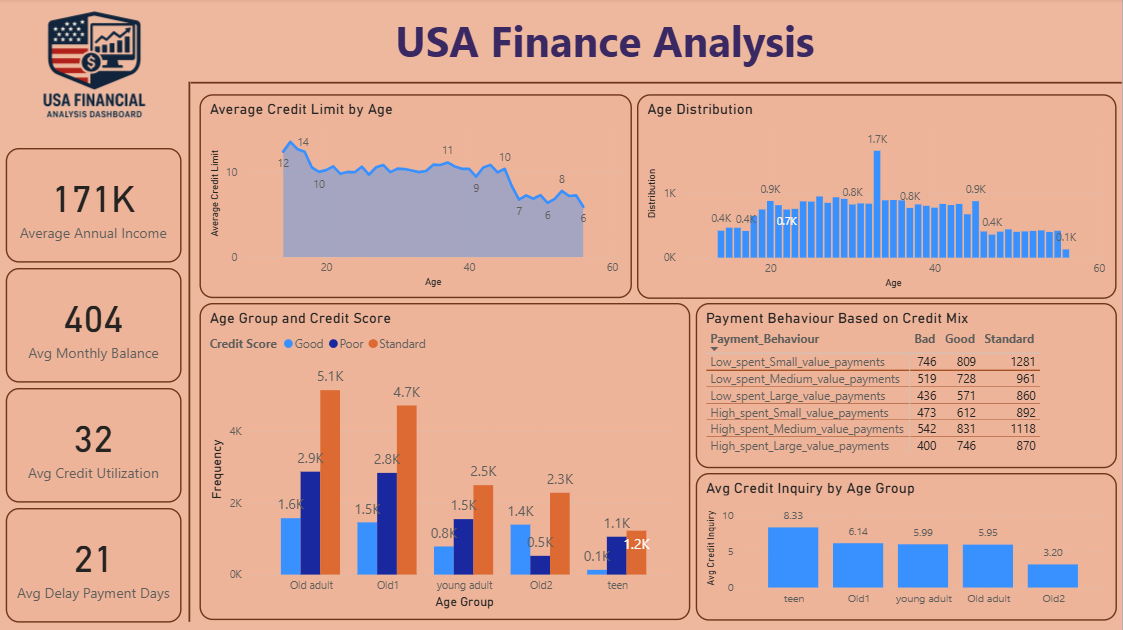
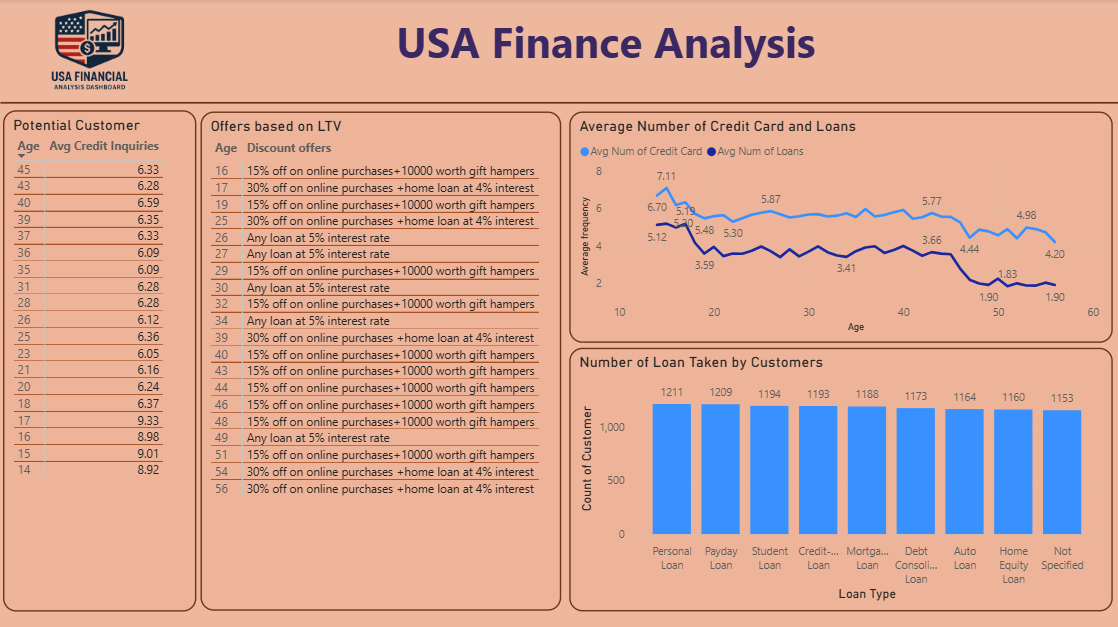
5. Dashboard & Insights (Power BI)
Created interactive dashboards with slicers, DAX measures, custom visuals (cohort bar charts, distribution plots) deployed to Power BI Service for daily refresh and stakeholder access.
Technology Summary
- Outlook & Power Automate: Access email metadata and attachments.
- Google Drive API: Secure file handling and access from cloud.
- Python:
pandasfor ETL logic,google-authlibraries for secure API usage. - Power Query: M-code transformations with custom logic, filters, and performance boosts.
- Power BI: Dashboard layer with DAX metrics, filters, and visuals.